Mon to Fri: 11:00am to 7:00pm

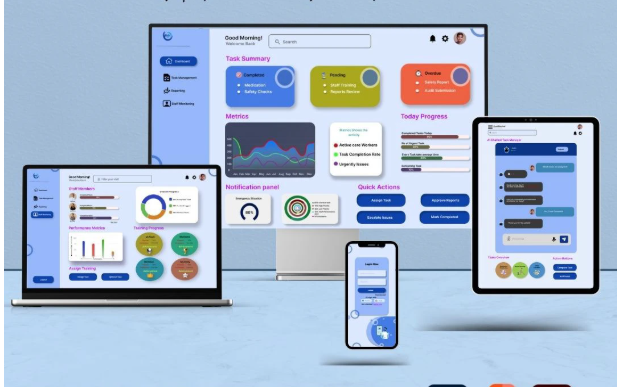
Predictive Analysis Dashboard
Forecasting trends and empowering data-driven decisions
Project Overview
Transforming raw data into actionable insights and future foresight
Our AI predictive analysis dashboard empowers business leaders with actionable insights through advanced data visualization. It seamlessly integrates current and historical data, presenting trends in an intuitive, interactive interface. Built-in predictive models leverage AI to forecast future market trends with high accuracy. The platform supports real-time data updates, ensuring timely and relevant insights for decision-making. Customizable widgets allow users to tailor the dashboard to their specific business needs. Scalable architecture ensures robust performance, even with large datasets and high user traffic. Secure data handling protects sensitive information while maintaining compliance with industry standards. The dashboard integrates with existing business systems for streamlined operations. Comprehensive analytics provide deep insights into performance metrics and growth opportunities. This solution equips leaders with the tools to anticipate changes and drive proactive, strategic decisions.
40%
Decision Speed Increase
90%
Forecast Accuracy
75%
User Adoption Rate
60%
Efficiency Gains

Client
Insight Dynamics Inc.
Industry
Data & Consulting
Platform
Web Application
Duration
8 Months
Status
Live
Team
5 Members

The Challenge
Moving from retrospective reporting to forward-looking strategy
Many businesses rely on traditional dashboards that only show past performance. This reactive approach makes it difficult to plan for the future. The challenge was to create a tool that could turn data from a record of what happened into a predictive guide for what will happen.
Reactive, not proactive, decision-making
Lack of foresight into market trends
Complex and difficult-to-interpret data reports
Manual forecasting prone to human error
Disparate data sources and lack of a unified view

Our Solution
Creating an intuitive, intelligent data hub
01
Data Integration
Consolidated data from multiple sources into a single, unified view
02
Predictive Model Development
Implemented machine learning models to generate accurate forecasts
03
Interactive UI Design
Designed a clean, interactive dashboard for easy data exploration and insight

Key Features
Powerful tools for data-driven foresight
Trend Forecasting
Visualizations of future sales, user growth, and other key trends
Customizable Metrics
Users can select and track the KPIs most relevant to their business
Intelligent Alerts
Notifications for significant data changes or deviations from forecasts
Real-time Data
Live updates ensuring decisions are based on the latest information

Project Impact
Improved foresight and strategic planning
40%
Decision Speed
Reduced time to make critical business decisions
90%
Forecast Accuracy
High precision in predicting future market and sales trends
75%
User Adoption
High engagement and usage from key stakeholders and analysts
60%
Efficiency Gains
Streamlined analytics process and reduced manual reporting efforts